How To Better Understand Your Site
Case Study: Rapid and Detailed Contaminant Delineation Program Achieved Using High Resolution Characterization (HRSC)
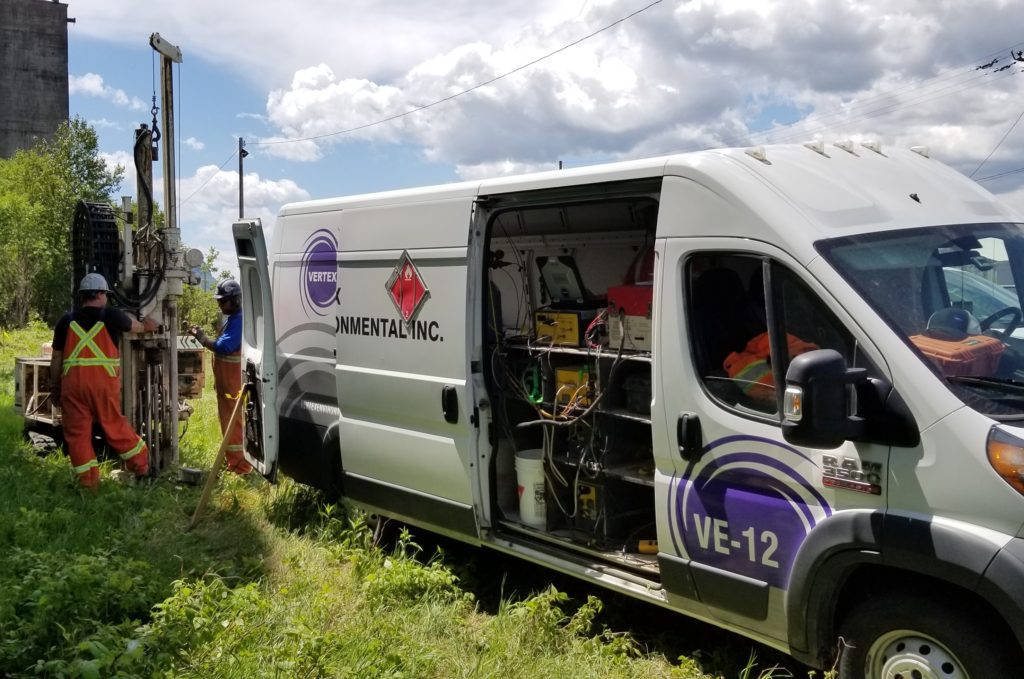
High Resolution Site Characterization – High Res Van and Direct Push Drill
Since 2011, when Vertex was the first to bring a suite of High Resolution Site Characterization (HRSC) technologies into Canada, the “High Res” tools have turned from an experimental idea to an integral part of site understanding and site remediation. This newsletter presents the results of a recent job site where High Res was used to aide in the development of the Conceptual Site Model (CSM) and remediation design.
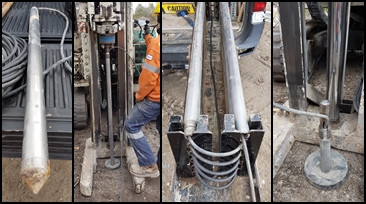
Advancing a High Res Probe into the Ground to Collect Detailed Subsurface Site Characterization Data
This past autumn HRSC was used at a large historical site with widespread chlorinated volatile organic compound (cVOC) contamination. Although numerous previous environmental investigations had been completed over the past few decades, much of the analytical results were outdated and/or incomplete, and yet the landowner was eager to move forward with full-scale remediation. Initial ranges of remediation cost estimates were quite wide due to the uncertainty around subsurface contamination. Not interested in completing an additional Phase II Environmental Site Assessment (ESA) investigation to update/refresh the analytical data for the site, the client instead requested the completion of a more complete widespread snapshot of the subsurface to understand the distribution of cVOCs on-site and, in doing so, narrow the range of the full-scale remediation cost estimates.
All of Vertex’s HRSC tools were deployed at the site including Laser Induced Fluorescence (LIF), Membrane Interface Probe (MIP), Low Level Membrane Interface Probe (LLMIP) and hydraulic Profiling Tool (HPT). The most used tool proved to be the LLMiHpt (LLMIP and HPT combined into one push). This combination probe allowed for significant data acquisition with a single push, to characterize not only the subsurface permeability but the contaminant presence, type and distribution as well.
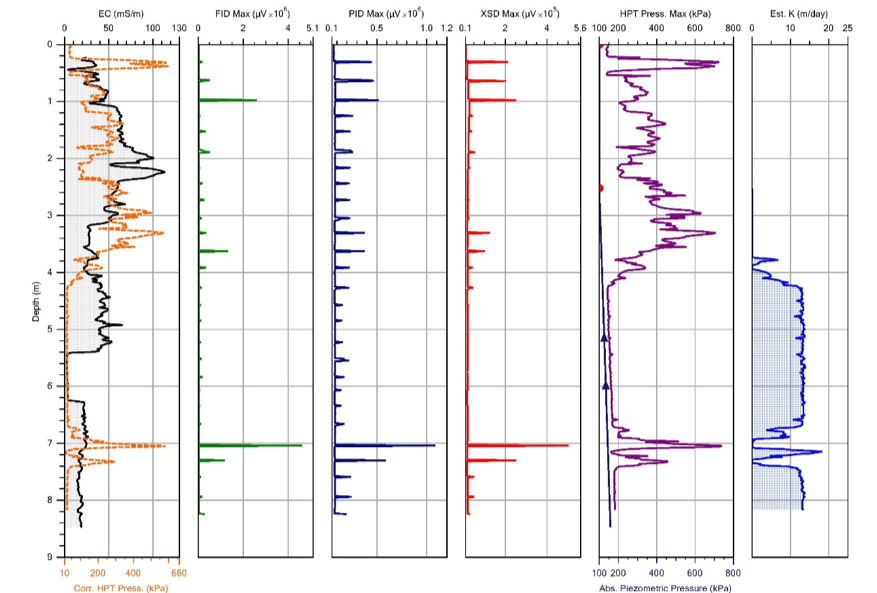
Example of Data Collected in One Push of the LLMiHpt Probe
A total of one hundred and eighty (180) locations were advanced at the site yielding almost 300,000 data points between the onboard electrical conductivity (EC) probe, all three MIP detectors (PID, FID and XSD), and the down-hole pressure transducer.
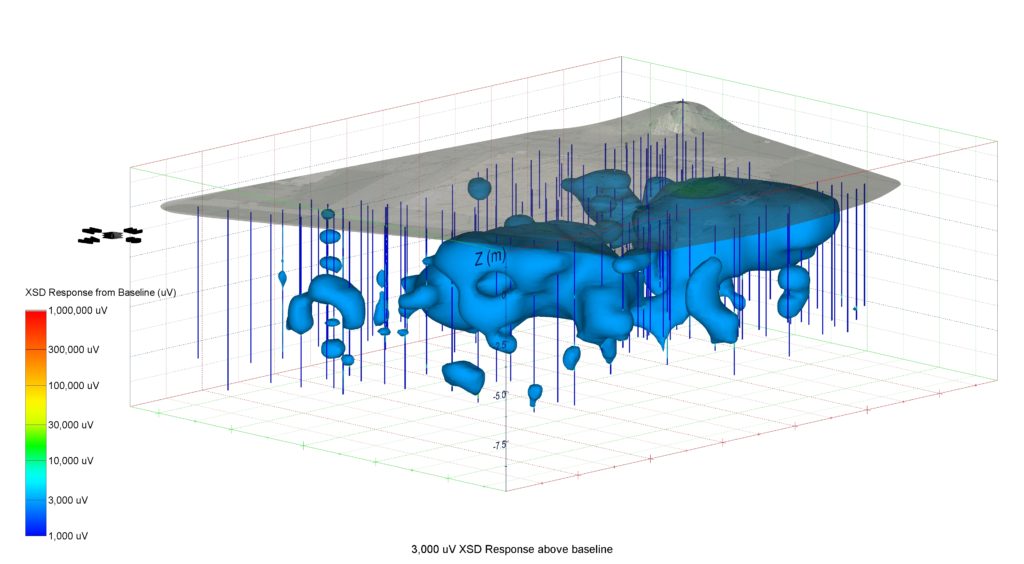
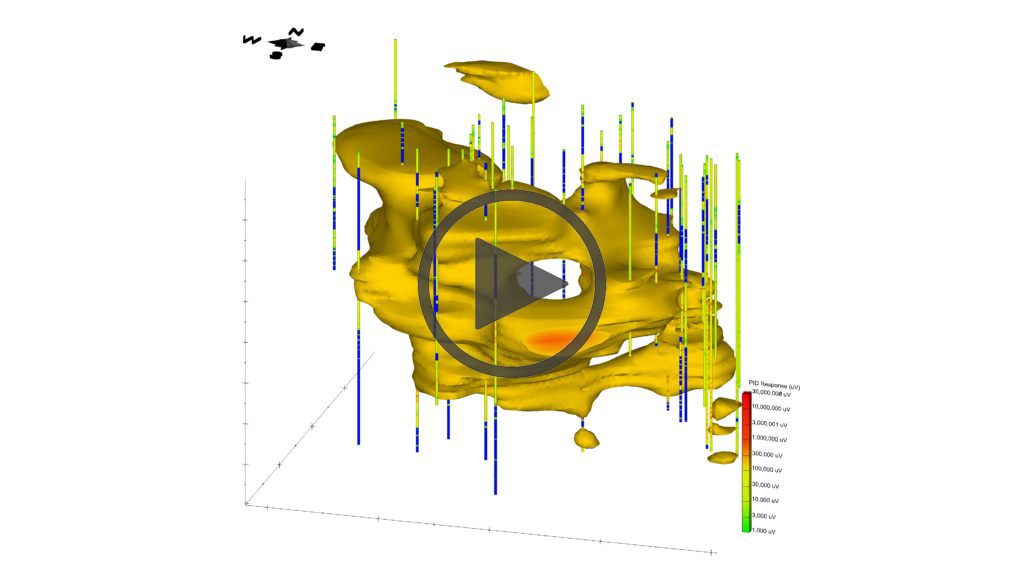
Visualization of Subsurface CVOC Impacts at the Case Study Job Site
These data were imported into Vertex’s 3D visualization software to understand how the contaminants are distributed on-site in 3D. This snapshot in time for the site was valuable for the client in designing a full-scale remediation plan.
The subsurface impacts were delineated efficiently and effectively using the direct push HRSC tools. The LIF tool was used for delineation of potential light non-aqueous phase liquids (LNAPLs) that may have remained in the subsurface in the vicinity of previous remedial excavations. The MiHpt, LLMiHpt and LLMIP tools were utilized to delineate any remaining dissolved phase VOC impacts on-site. During the project, a previously unknown “hot spot” of cVOCs was discovered and delineated quickly with the High Res tools. If the project had moved to the remediation phase without this information there could have been potential unknown cost overruns or contamination that would likely have been missed.
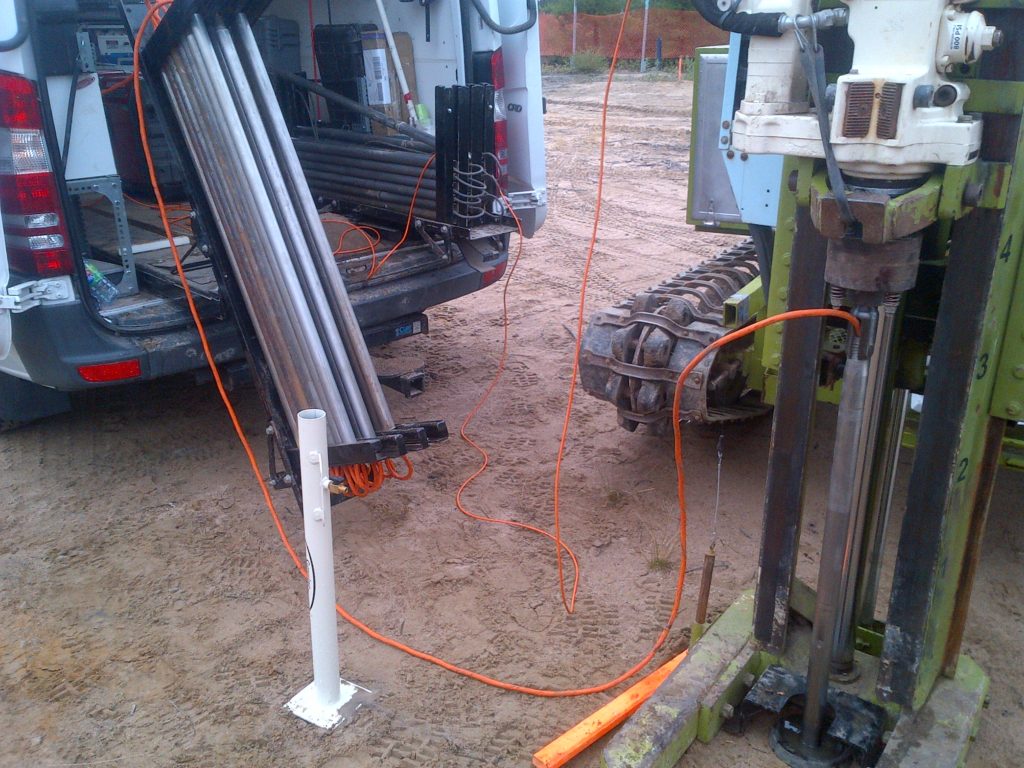
High Res Tooling Being Pushed and Collecting Data – up to 1 cm Vertical Scale Precision
The client also wanted to be able to relate the previous Phase II ESA analytical information with the updated HRSC data set. This was accomplished using historical and recent investigation analytical data that was correlated with proximate locations where High Res data was collected. Correlating the data sets has become a common practice here at Vertex as this can allow an estimate of the extent of contamination relative to numerical standards to be defined both vertically and horizontally. A ‘calibration curve’ was developed for the site and applied to the HRSC dataset to estimate the analytical concentration based on the response of the LLMiHpt.
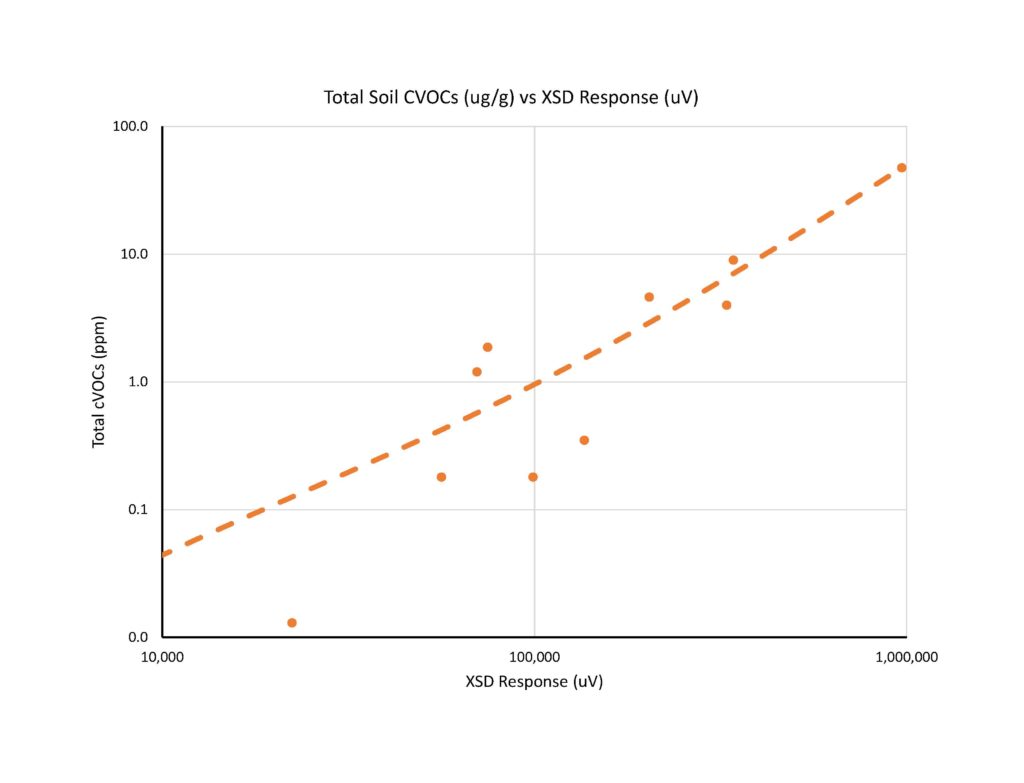
Correlation of Soil Analytical and High Res Data
The chlorinated solvent (cVOC) analytical data was compared to the HRSC data for the correlated locations and then extrapolated to the entire HRSC dataset to obtain a theoretical concentration profile for the site.
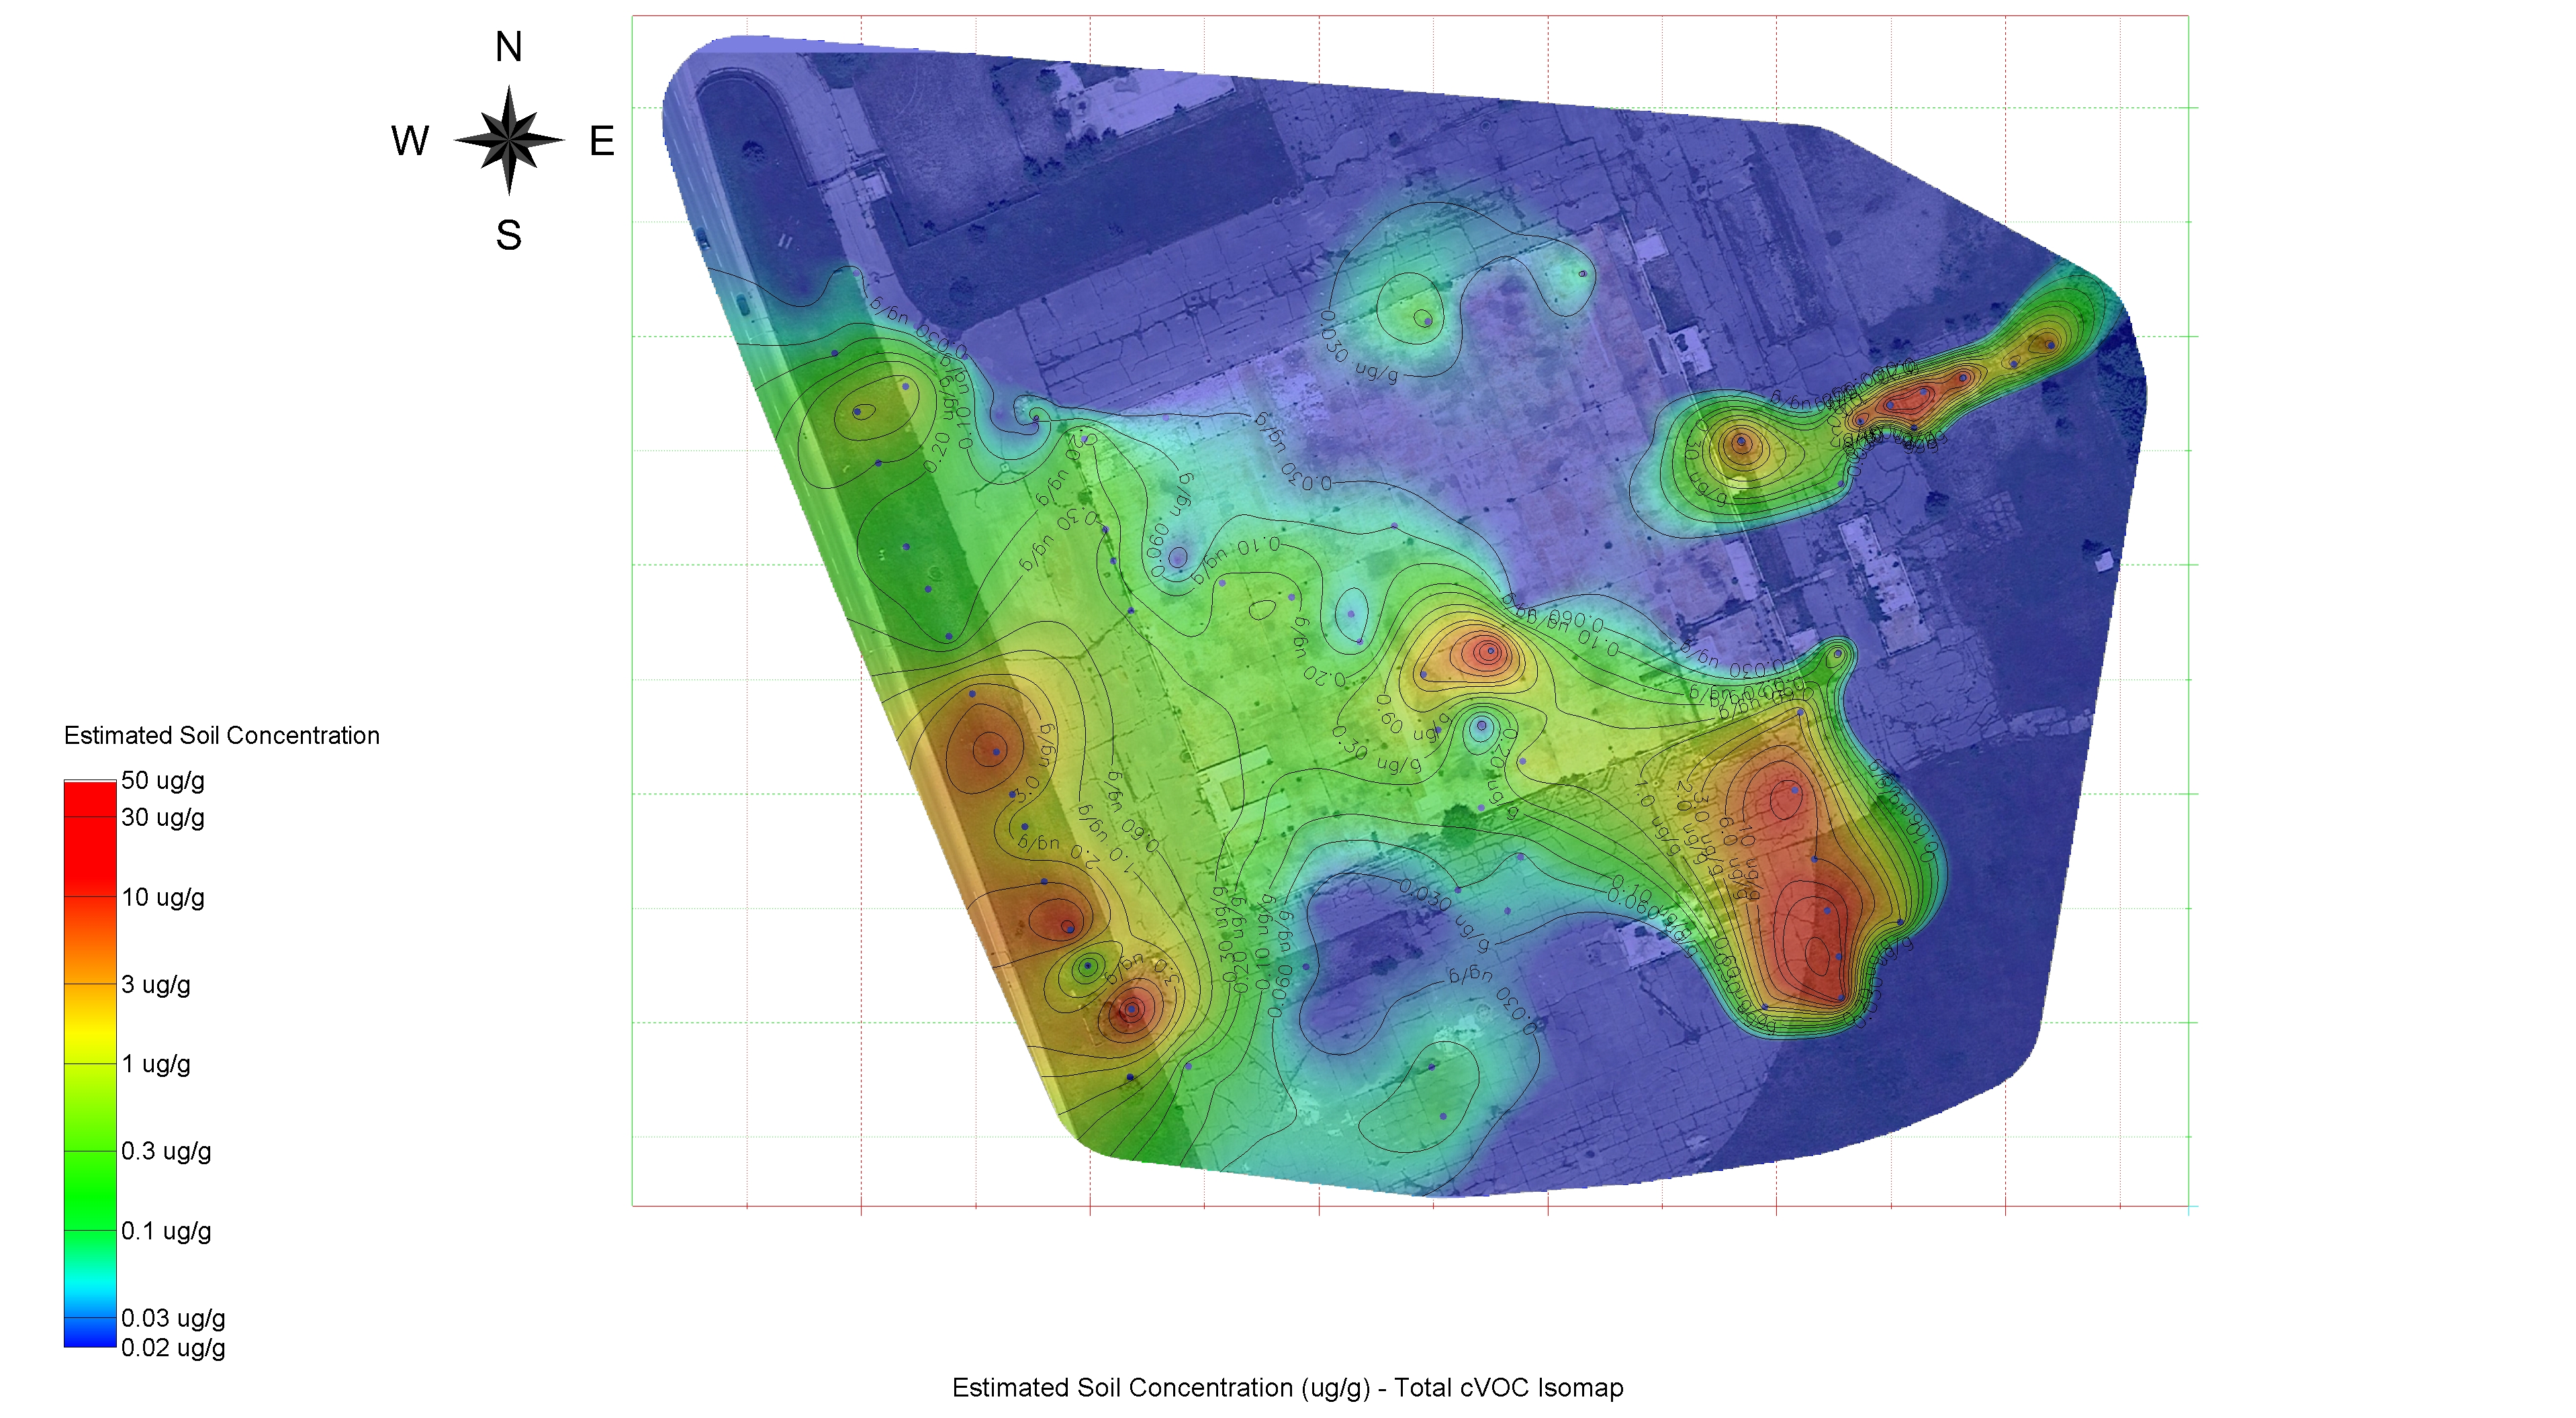
Estimated Soil CVOC Concentrations – Based Upon the High Res Data
Hot spots of higher responses were identified both laterally and vertically on-site. Not only were the impacts vertically delineated but the zones of high and low soil permeability were identified at the same time. The combination of contaminant concentration and soil permeability allows for detailed understanding of contaminant mass flux, risk, and ultimately results in a better remedial design.
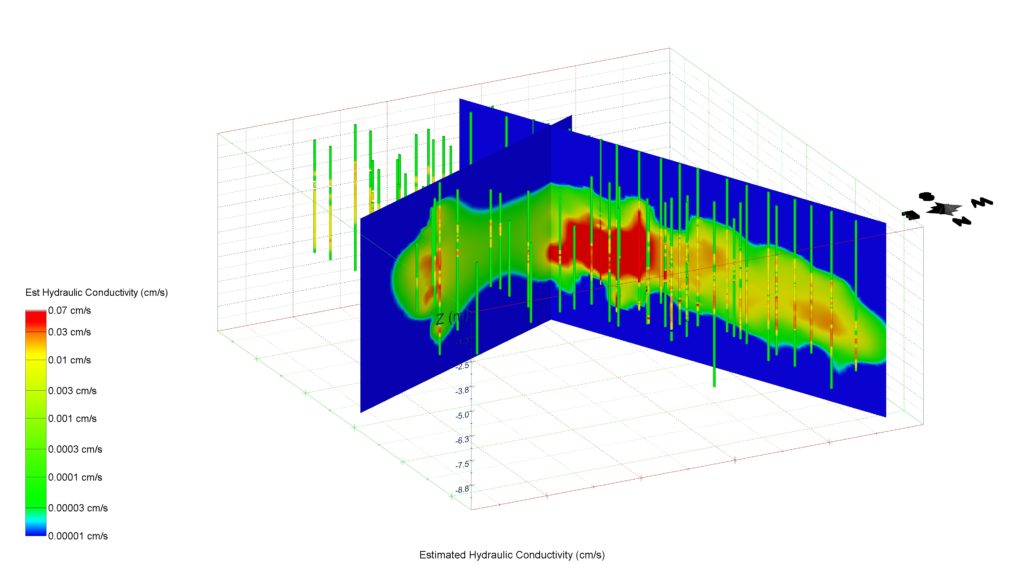
Estimated Soil Permeability – Hydraulic Conductivity (cm/s) – 3D Visualized – up to 1 cm Scale Precision
Understanding the subsurface permeability is important, especially for in-situ remediation and any groundwater extraction technologies. Utilizing the HPT (hydraulic profiling tool) data the results from the permeability analysis were displayed in 3D and provided the client with a much better understanding of how and where the groundwater was moving in the subsurface at their site.
The power of using High Resolution Site Characterization on this site was showcased, as the cVOCs were delineated in detail both horizontally and vertically, a new “hot spot” was identified, historical analytical data was correlated with new HRSC data, the subsurface permeability of the site was characterized, detailed 3D visualizations were created, and ultimately very accurate remedial cost estimates are now being obtained. Compared to a traditional Phase II ESA (drilling and sampling) approach it is likely that multiple iterations and mobilizations would have been required to achieve even close to the same level of delineation at the site. The HRSC tooling allowed for a faster, less expensive, and more complete understanding of the site!