
A Salty Tale of Probing

by Patrick O’Neill
About five years ago I began working with some innovative tools that profiles the subsurface in real time. While a lot of people are aware of these technologies and their main functions, whether it is profiling LNAPL impacts (LIF), dissolved phase impacts (MIP) or subsurface permeability (HPT), not everyone knows about the common measurement that all three probes record: Electrical Conductivity (EC)! EC is measured by the MIP, HPT and can be installed on the LIF for subsurface soil profiling in real time. The EC profile is a good indicator of soil grain size, moving from lower to higher EC is indicative of coarser to finer grain soils, respectively. One of the great things about measuring the EC and viewing the data in real time is that specific soil horizons can be identified in real time and the probe point can be terminated before a confining layer, such as a clay lens, is fully penetrated by carefully examining the EC profile as data is displayed at surface. Using traditional methods of drilling and sampling a field technician wouldn’t know if that is happening until the sample is brought up to surface and the clay lens is in fact penetrated, either partially (if you are lucky) or fully (if you are not).
This data is being collected constantly and displayed in real time on the logs in the field and in the reporting. However up until very recently I have only ever been asked to report the EC data on the individual logs and sometimes in cross sections along with the primary data (ie, contamination) recorded by individual probe.
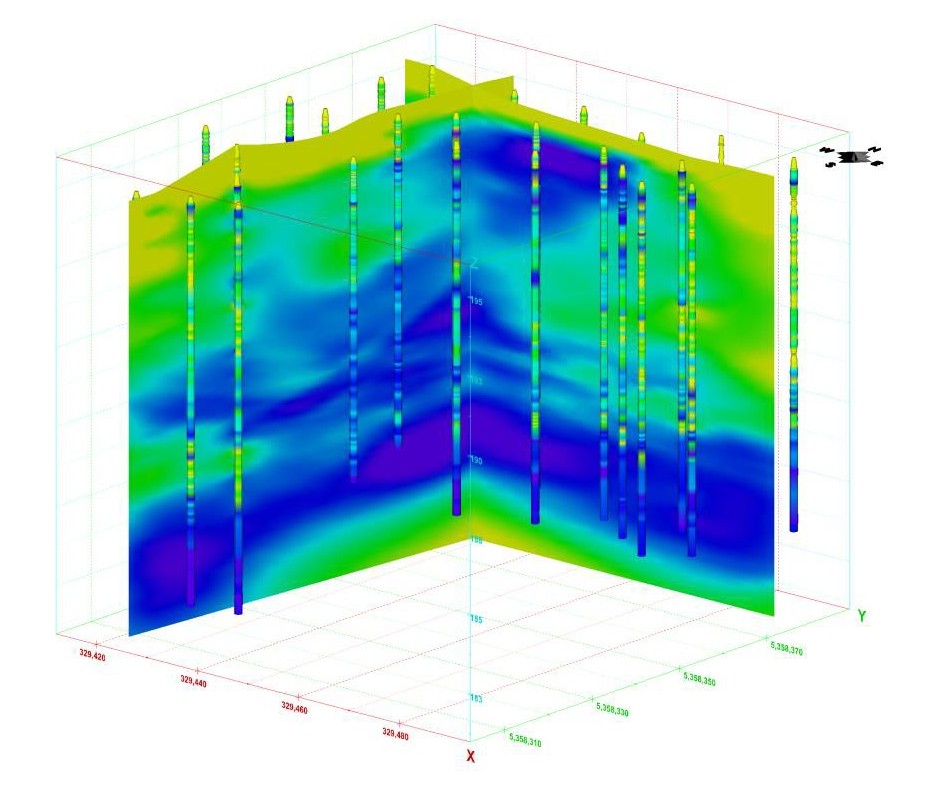
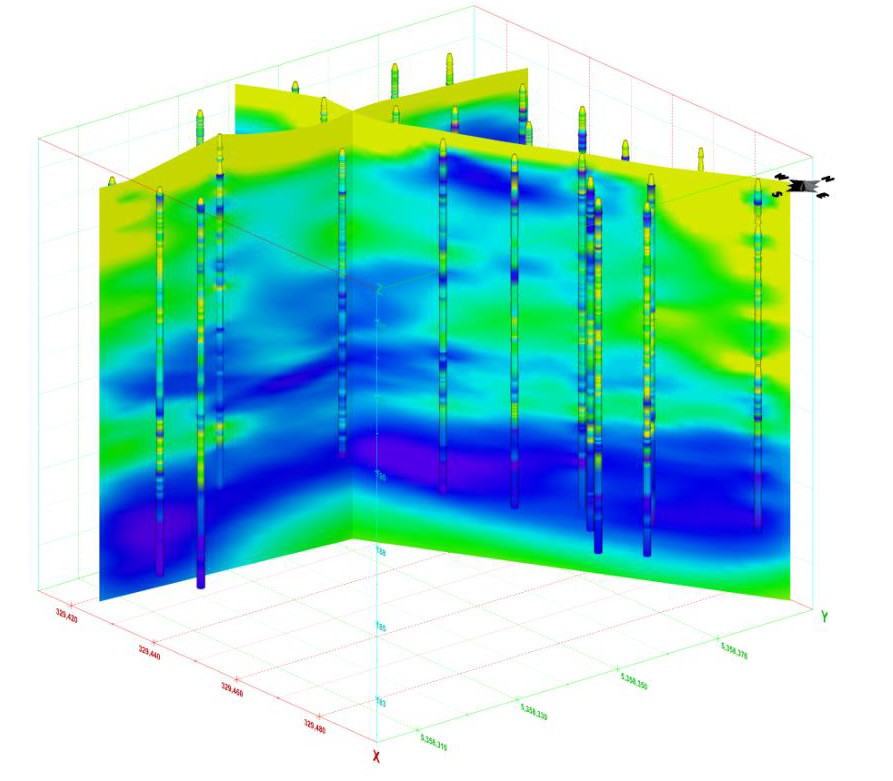
After completing a MIP survey in northern Ontario, the client wanted to further examine the subsurface soil profile with the 3D visualization software Vertex uses. I have to admit I thought long and hard about how best to display the data that would most accurately represent the subsurface. We looked at the data a few different ways and settled on using a series of “fences” or cross sections in the 3D software. I’ve included a few examples of what the data looks like for the EC profiling.
The data confirmed was collected in previous environmental studies and traditional soil borehole logging. This is important to show good correlation between the probes EC measurements and a field technician physical logging of soil types as they are brought to surface. The high resolution EC site characterization data showed us, in detail, that there were some zones of lower EC and higher EC throughout the subsurface. However a very distinct clay layer (higher EC shown in dark blue and purple) is defined at the bottom of most of the survey points. The majority of the points were terminated in this clay layer that was found however due to the type of impacts on Site the MIP survey was continued through the clay layer at specific locations. Subsequent sealing of the probe points using a hydrated benseal backfill to reinstate the clay layer and prevent creating a conduit from surface to the deep subsurface.
 |
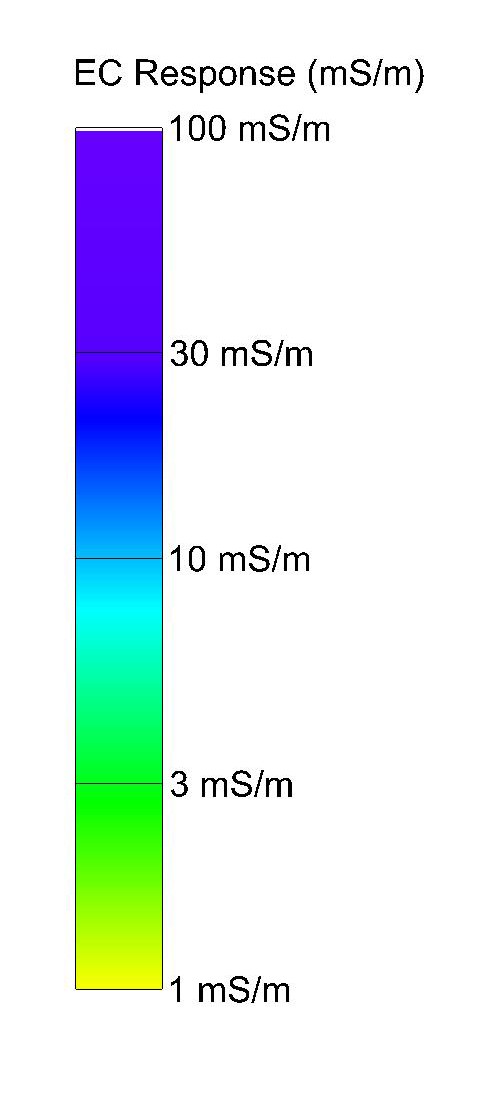
LEGEND:
|
At the end of the day, the client was very happy with all of the data collected and how we were able to demonstrate where the impacts were located in the subsurface, as well as how the soil types change in high resolution. The EC data collected proved to be very useful to expand the understanding of subsurface on-Site. Having the EC lithology data in high resolution is another tool in the client’s toolbox for understanding the potential contaminant migration pathways and subsequent remedial plans!